 |
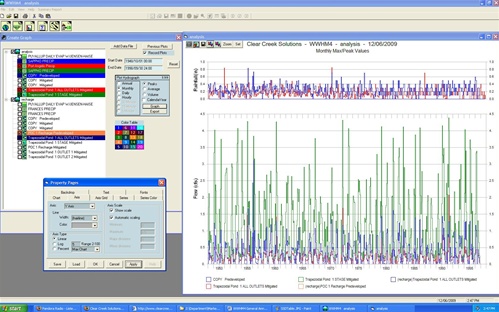
The WWHM4 graphing routines allow for greater flexibility and control in graphing the precipitation, flow, and stage time series stored in the WWHM4 data base file.
Multiple time series can be plotted in a single graph.
The plotted graph values can be automatically copied to Windows Clipboard and then pasted in any Microsoft application.
- Graph data from multiple HSPF WDM and SWMM data files together
- Save and Load Graphs including files, timeseries, and chart settings
- Seperate Precipitation Graph
- Full Control over all Graph propeties
- Zoom control
- Export values to clipboard or save as file for use with other applications
|
|
|
